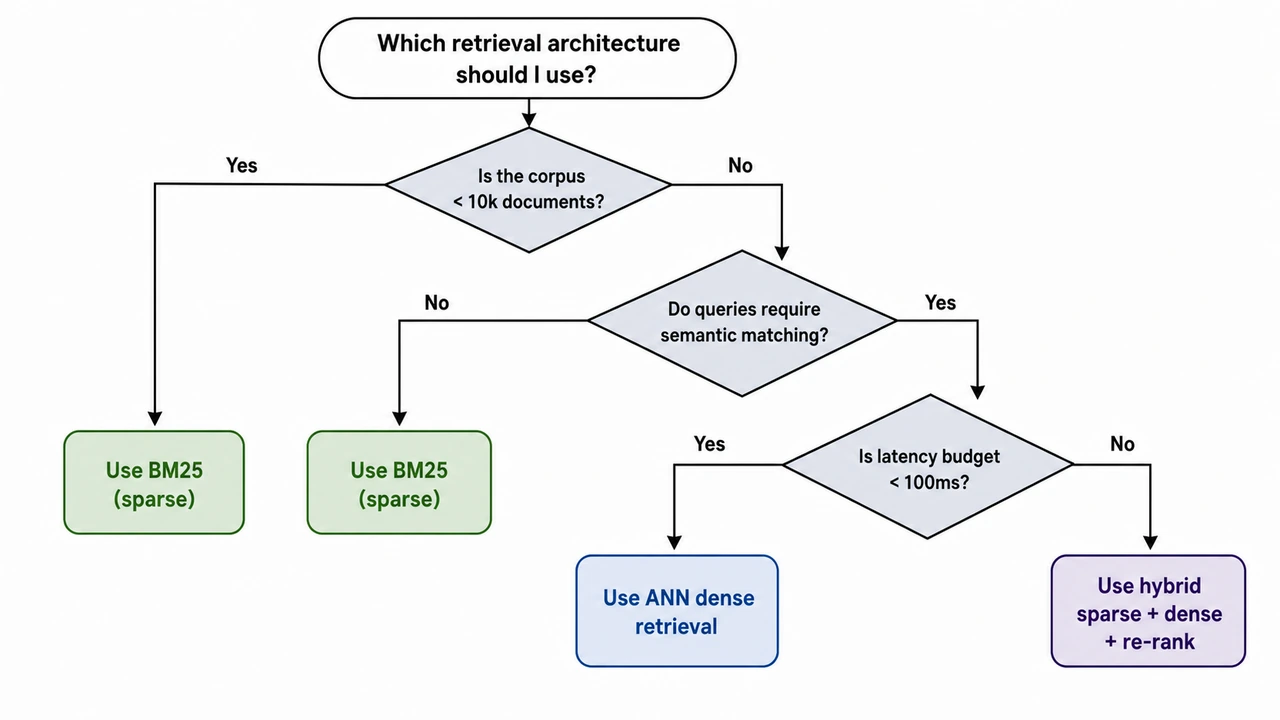
Decision-Tree Selection Workflow
A decision-tree selection workflow drawn top-down. Top — Starting Question (oval node): "Which retrieval architecture should I use?" Three sequential decision nodes (diamonds) below, each binary: Q1 — "Is the corpus < 10k documents?" - Yes -> "Use BM25 (sparse)" (leaf, green) - No -> continue to Q2 Q2 — "Do queries require semantic matching?" - No -> "Use BM25 (sparse)" (leaf, green) - Yes -> continue to Q3 Q3 — "Is latency budget < 100ms?" - Yes -> "Use ANN dense retrieval" (leaf, blue) - No -> "Use hybrid sparse + dense + re-rank" (leaf, purple) Three colored leaf nodes at the bottom showing the recommendations. Style: clean academic vector, white background, restrained palette (slate diamonds, green / blue / purple leaves), sans-serif. Branch labels ("Yes" / "No") on every edge. Optimised for poster and slide readability.