연간 요금제 50% 할인

Paper Banana AI 논문 그림 생성기

논문의 방법론, 실험 결과, 프롬프트 템플릿, 스케치를 명확하고 편집 가능한 학술 일러스트로 만드세요. 논문, 포스터, 연구계획서, 발표 자료에 활용할 수 있습니다.

공개 연구 기준: 5개 에이전트 · NeurIPS 2025 사례 292개 · 평가 기준 4개

Academic illustration preview
그림 미리보기

생성된 논문 그림 초안이 여기에 표시됩니다.

방법론을 논문 그림 초안으로 바꾸는 워크플로

Paper Banana 논문 그림 예시

모델 구조, 방법론 흐름, 평가 패널, 논문 스타일 학술 그림을 살펴보세요. 연구에 가까운 예시를 고른 뒤 내 내용으로 바꿔 바로 시작할 수 있습니다.

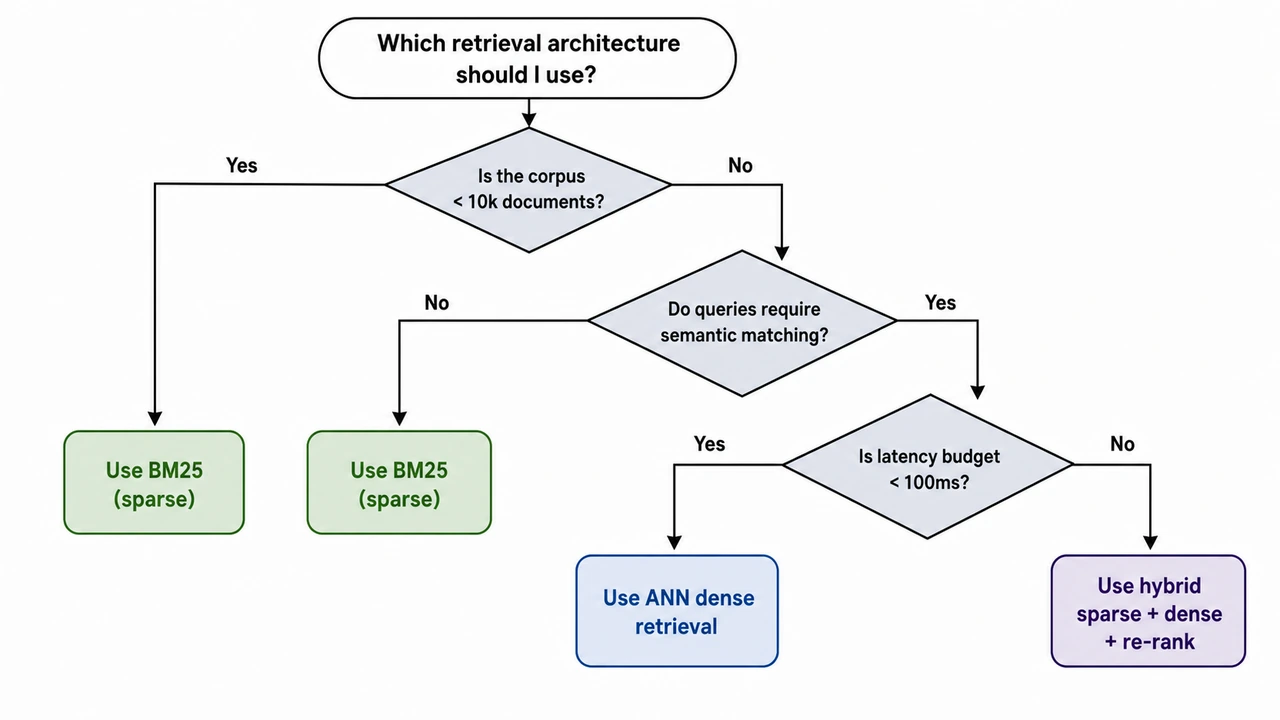
의사결정 트리 선택 워크플로

의사결정 트리 선택 워크플로

A decision-tree selection workflow drawn top-down. Top — Starting Question (oval node): "Which retrieval architecture should I use?" Three sequential decision nodes (diamonds) below, each binary: Q1 — "Is the corpus < 10k documents?" - Yes -> "Use BM25 (sparse)" (leaf, green) - No -> continue to Q2 Q2 — "Do queries require semantic matching?" - No -> "Use BM25 (sparse)" (leaf, green) - Yes -> continue to Q3 Q3 — "Is latency budget < 100ms?" - Yes -> "Use ANN dense retrieval" (leaf, blue) - No -> "Use hybrid sparse + dense + re-rank" (leaf, purple) Three colored leaf nodes at the bottom showing the recommendations. Style: clean academic vector, white background, restrained palette (slate diamonds, green / blue / purple leaves), sans-serif. Branch labels ("Yes" / "No") on every edge. Optimised for poster and slide readability.
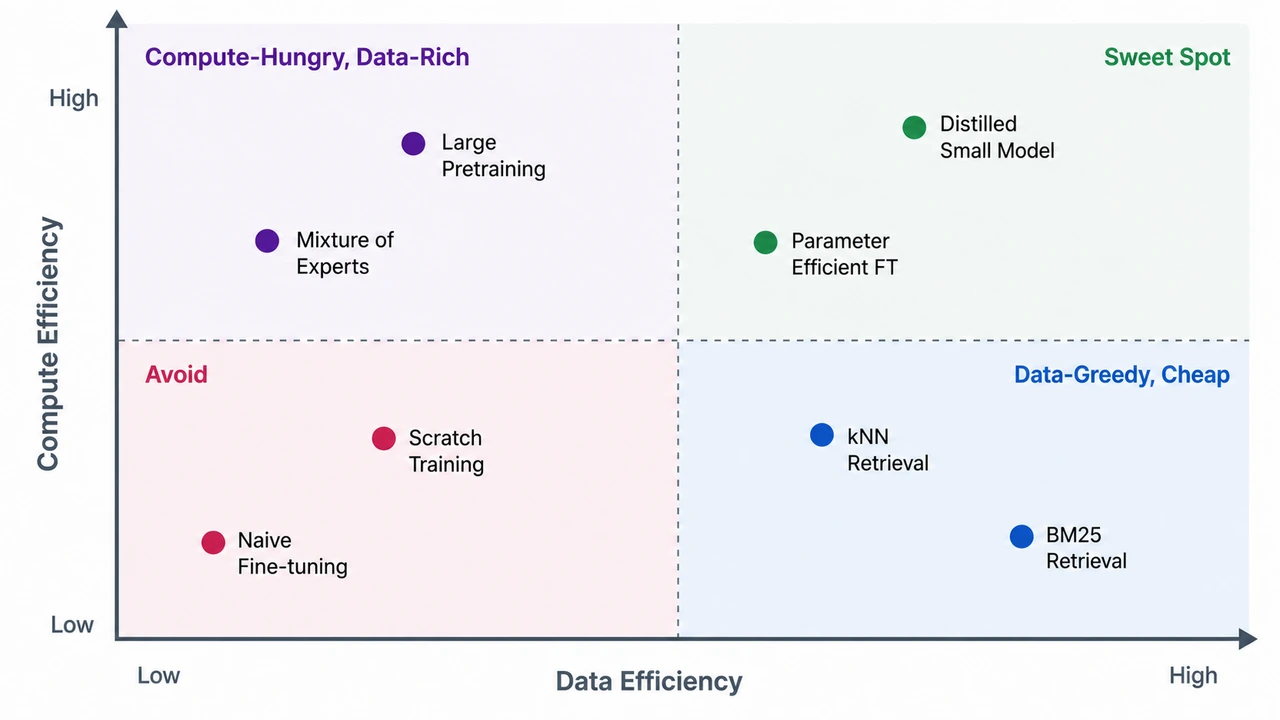
4분면 포지셔닝 매트릭스

4분면 포지셔닝 매트릭스

A 2x2 positioning matrix with two axes and four labeled quadrants. Axes: - X-axis (horizontal): "Data Efficiency" — left = low, right = high - Y-axis (vertical): "Compute Efficiency" — bottom = low, top = high Four quadrants: - Top-left: "Compute-Hungry, Data-Rich" — methods that need lots of compute and tolerate data scarcity (e.g., huge pretraining) - Top-right: "Sweet Spot" — high efficiency on both axes (e.g., distilled small models) - Bottom-left: "Avoid" — both inefficient (e.g., naive scratch training) - Bottom-right: "Data-Greedy, Cheap" — needs lots of data but cheap to run (e.g., kNN retrieval) Plot 6-8 example methods as labeled dots distributed across all four quadrants. Each dot has a 1-2 word label. Style: clean publication-style scatter, white background, slate axes with one accent color per quadrant, sans-serif. Quadrant headers in upper-corner of each quadrant. Suitable for survey papers and consultancy decks.

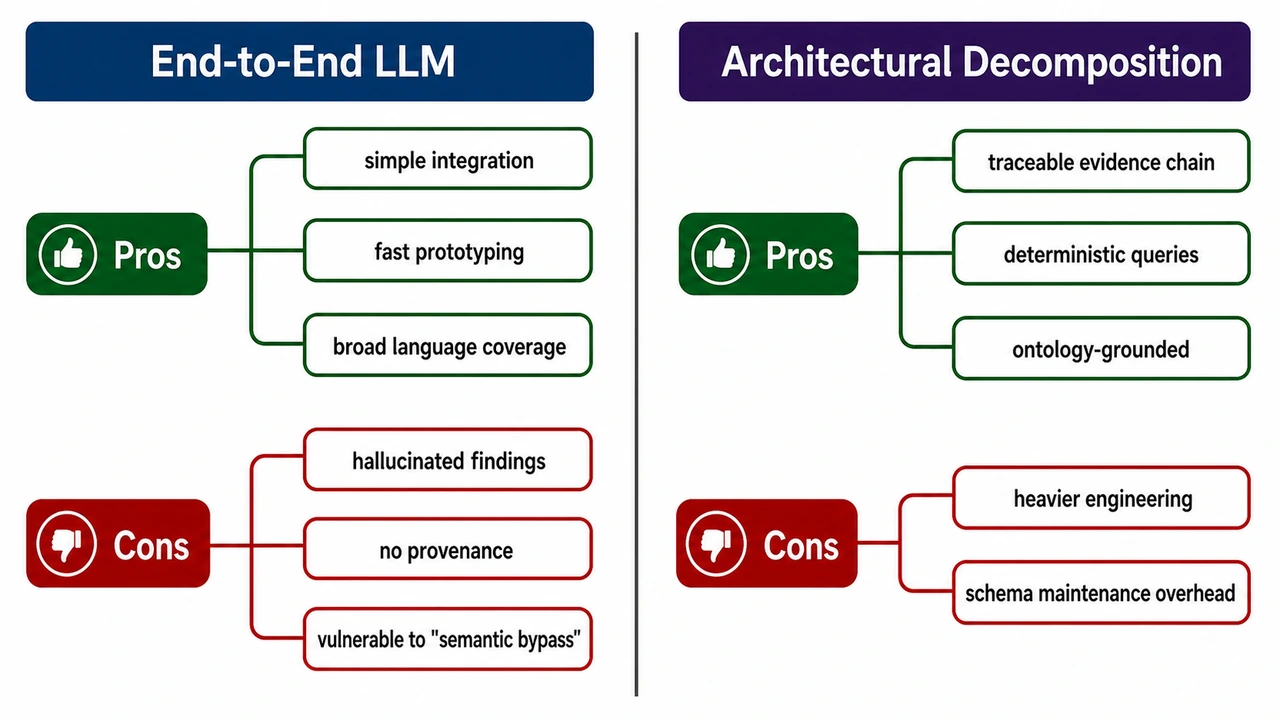
방법 비교 마인드맵(장점·단점)

방법 비교 마인드맵(장점·단점)

A horizontal mind-map comparing two approaches for vulnerability discovery in source code. Left side: "End-to-End LLM" Right side: "Architectural Decomposition" Each side has two color-coded branches: - Pros (dark green) - Cons (dark red) End-to-End LLM Pros: simple integration; fast prototyping; broad language coverage. Cons: hallucinated findings; no provenance; vulnerable to "semantic bypass". Architectural Decomposition Pros: traceable evidence chain; deterministic queries; ontology-grounded. Cons: heavier engineering; schema maintenance overhead. Layout: central vertical divider; method title at top of each side in a colored header bar; pros branches above, cons below. Use clean rounded labels, generous whitespace, sans-serif typography. Optimize for poster readability. White background.

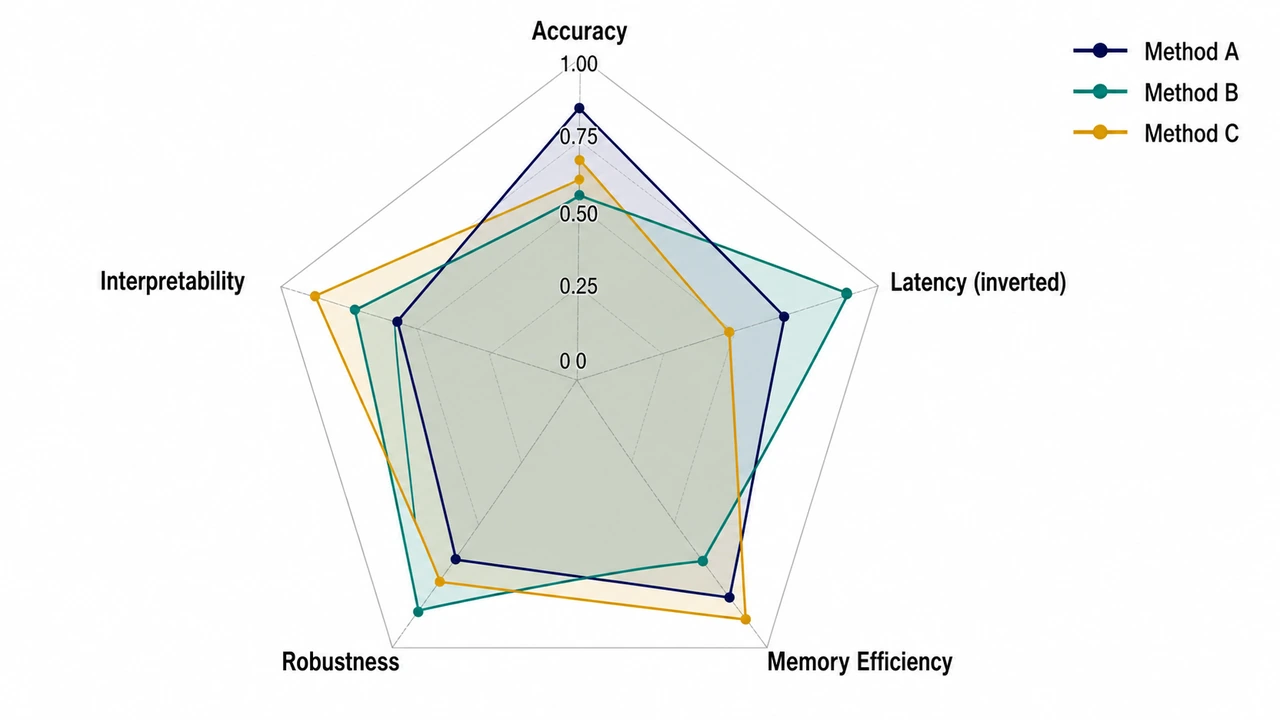
방법 비교 레이더 차트

방법 비교 레이더 차트

A radar (spider) chart comparing three methods on five evaluation dimensions. Five axes (radiating from center, going clockwise from top): 1. Accuracy 2. Latency (inverted: higher = lower latency) 3. Memory Efficiency 4. Robustness 5. Interpretability Three methods plotted as colored polygons: - Method A (navy fill at 25% opacity, navy border) - Method B (teal fill at 25% opacity, teal border) - Method C (amber fill at 25% opacity, amber border) Numeric scores 0-1 along each axis, with grid rings at 0.25 / 0.50 / 0.75 / 1.00. Legend top-right with the three methods and their colors. Style: clean academic radar chart, white background, restrained palette, sans-serif labels. Optimise for legibility on a poster.

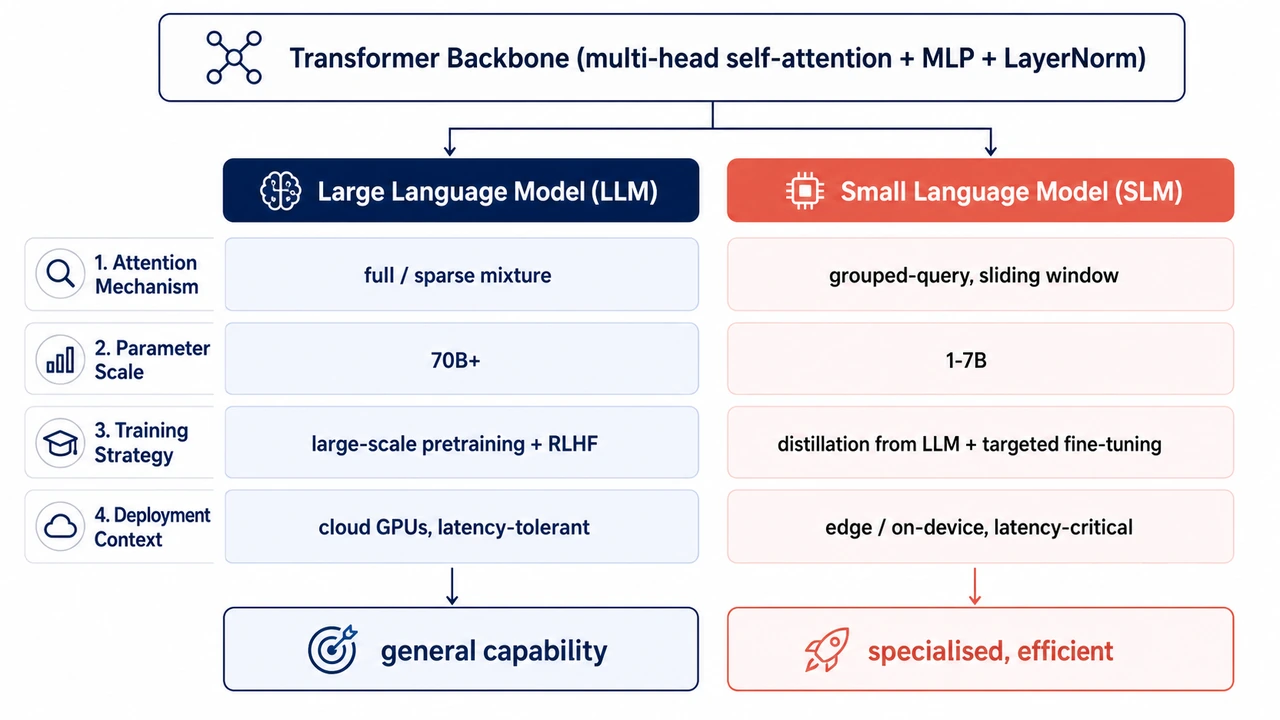
공통 기반과 서로 다른 선택 비교

공통 기반과 서로 다른 선택 비교

Create a clean comparison diagram titled "Shared Foundation, Divergent Choices" for an academic paper. Layout: - Top: one wide shared foundation block labeled "Shared pretraining foundation" with small icons for data, tokenizer, transformer layers, and optimization. - From the shared block, split into two parallel columns: "System A" and "System B". - Add four comparison rows: Attention pattern, Model scale, Training objective, Deployment context. - Each row should show matched but divergent choices, connected back to the shared foundation with subtle branching arrows. - Bottom: two outcome boxes labeled "Efficiency / controllability" and "Capability / generalization". Style: - Publication-ready vector-like diagram on white background. - Navy foundation block, teal System A accents, coral System B accents, neutral gray dividers. - Use concise labels only, maximum 6 words per cell. - Include small schematic icons but no decorative clutter. - Sans-serif typography, high contrast, suitable for a methods or related-work figure.

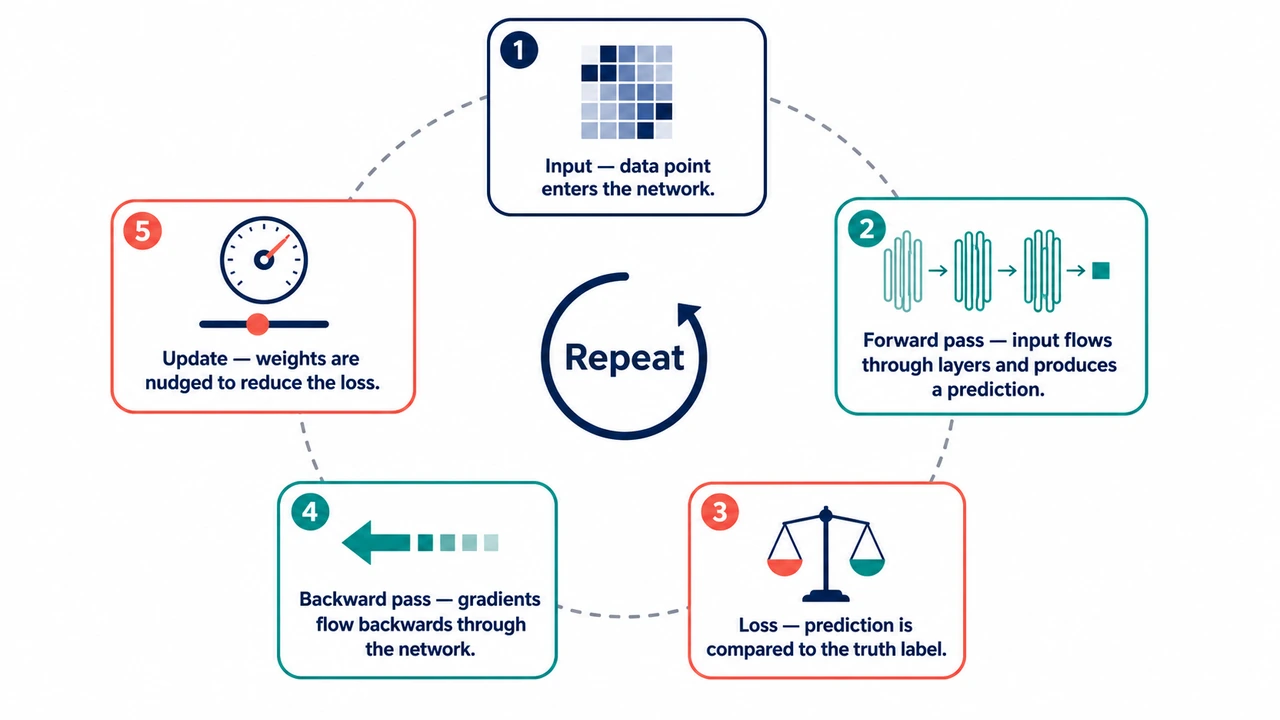
교육용 프로세스 순환 인포그래픽

교육용 프로세스 순환 인포그래픽

An educational infographic showing how a neural network learns, in five steps arranged around a circle. Steps (clockwise, starting from 12 o'clock): 1) Input — data point enters the network. Icon: small grid of pixels. 2) Forward pass — input flows through layers and produces a prediction. Icon: stacked rectangles with arrows. 3) Loss — prediction is compared to the truth label. Icon: balance scale. 4) Backward pass — gradients flow backwards through the network. Icon: backward arrow. 5) Update — weights are nudged to reduce the loss. Icon: small dial / slider. Center of the circle: a small "Repeat" label with a circular arrow. Style: - Friendly but professional palette: navy, teal, coral on white. - Each step is a rounded rectangle on the circle's perimeter, with the icon on top and a one-line caption (max 6 words) below. - Numbered badges (1–5) in the top-left of each step. - Light dashed circle connecting the steps to suggest the cycle. - Sans-serif, optimized for textbook-page readability.

정적 이미지PNG
편집 가능하게 재구성하기 전의 정적 논문 그림
편집 가능한 재구성
편집 가능하게 재구성된 논문 그림

요소 편집

텍스트 / 화살표 수정

Paper Banana AI란?

Paper Banana AI는 방법론 텍스트, 프롬프트 템플릿, 스케치, 참고 이미지를 구조화된 학술 다이어그램으로 바꿔 주는 AI 논문 그림 생성기입니다. 빈 슬라이드에서 시작하지 않고도 방법 구조도, 모델 아키텍처, 통계 시각화, 투고용 그림을 초안할 수 있습니다.

구조를 우선하는 생성

시각적 장식보다 모듈, 레이블, 화살표, 레이아웃 계층, 가독성을 먼저 잡아 실제로 다듬을 수 있는 연구 구조로 시작합니다.

참고 자료를 반영한 학술 스타일

프롬프트 예시나 참고 이미지로 그림 유형, 시각 스타일, 전문 용어를 안내해 익숙한 논문 그림 관례에 맞추어 갑니다.

편집하고 검토할 수 있는 그림

생성 결과를 최종본이 아닌 검토 가능한 초안으로 사용하세요. 레이블과 관계를 고치고 레이아웃을 다듬어 논문, 포스터, 연구계획서, 발표 자료로 내보낼 수 있습니다.

Paper Banana AI로 무엇을 만들 수 있나요?

논문 내용, 프롬프트 템플릿, 스케치, 기존 그림에서 시작해 방법 구조도, 모델 아키텍처, 편집 가능한 재구성 그림, 투고 전에 계속 다듬을 수 있는 논문 그림을 만들 수 있습니다.

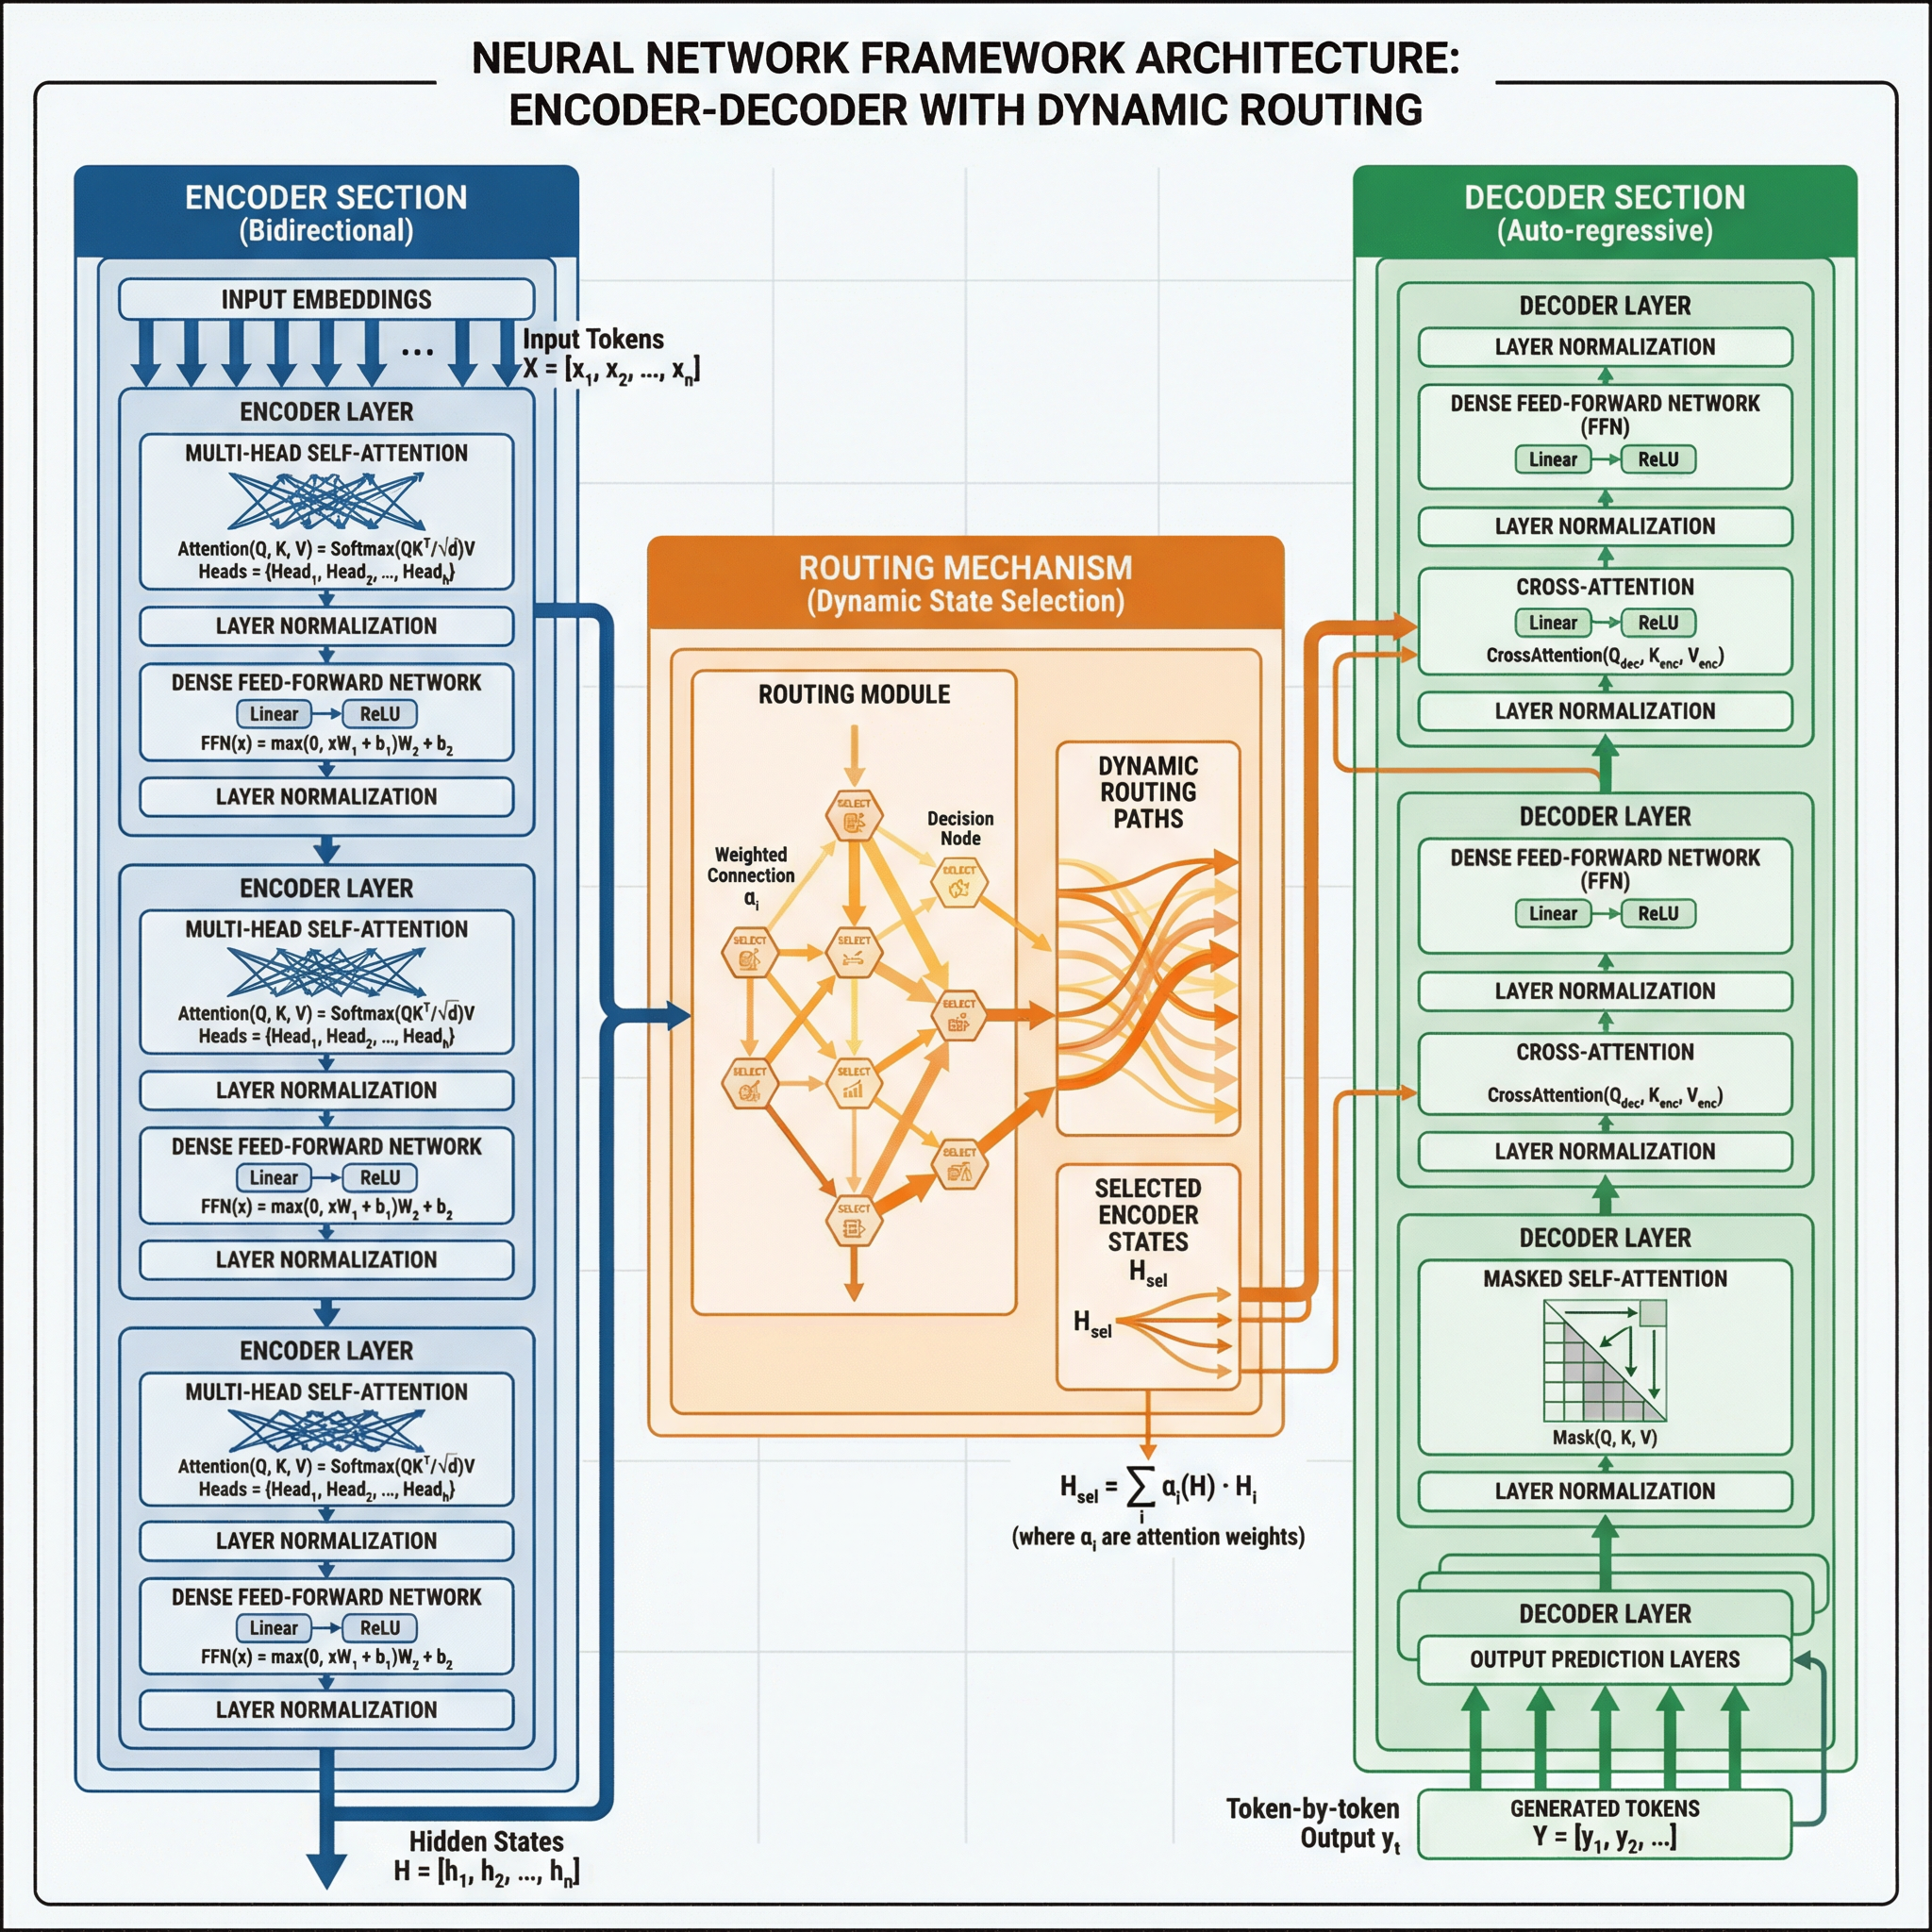
방법론 구조도

방법론 구조도

빈 캔버스, 방법론 문단, 프롬프트 템플릿에서 시작하세요. Paper Banana가 모듈, 화살표, 레이아웃, 짧은 레이블을 잡아 검토 가능한 첫 초안을 만듭니다.

정적 이미지PNG
편집 가능하게 재구성하기 전의 정적 논문 그림
편집 가능한 재구성
편집 가능하게 재구성된 논문 그림

요소 편집

텍스트 / 화살표 수정

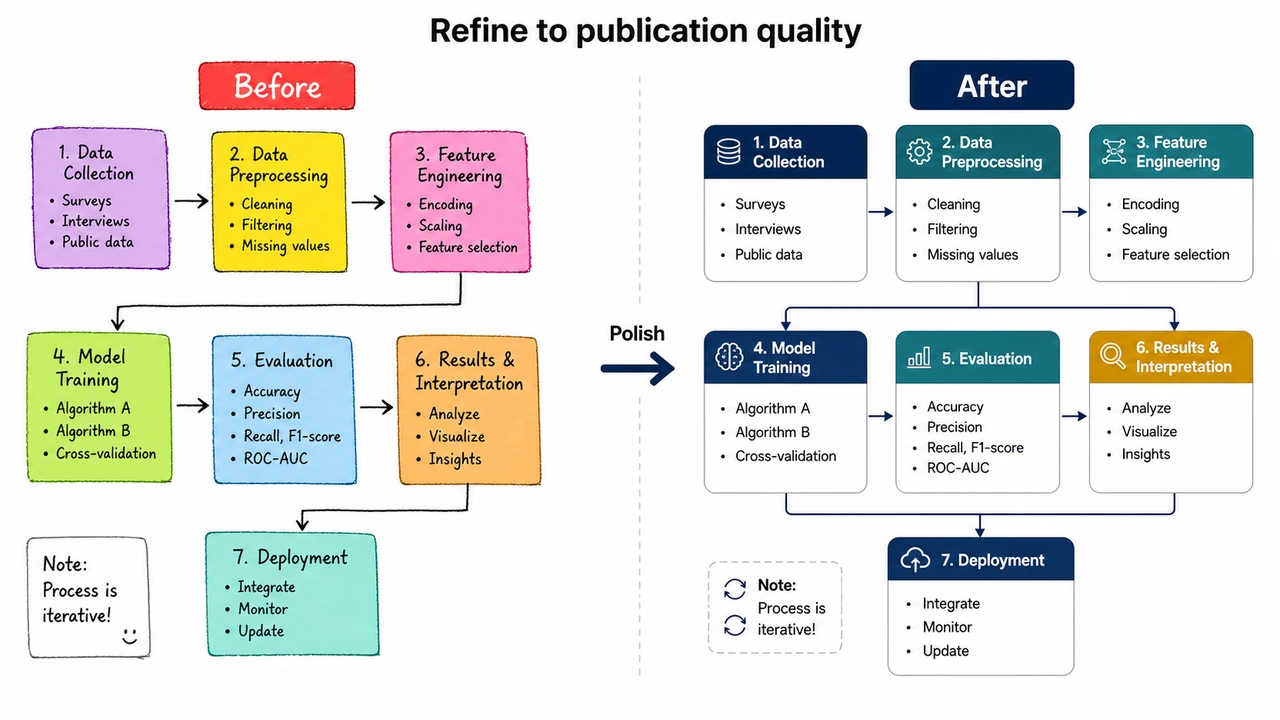
편집 가능한 논문 그림 재구성

생성 후에도 텍스트, 화살표, 색상, 레이아웃을 수정할 수 있습니다. 수정이 어려운 한 장의 AI 이미지에 멈추지 않아도 됩니다.

프롬프트 기반 학술 일러스트

프롬프트 기반 학술 일러스트

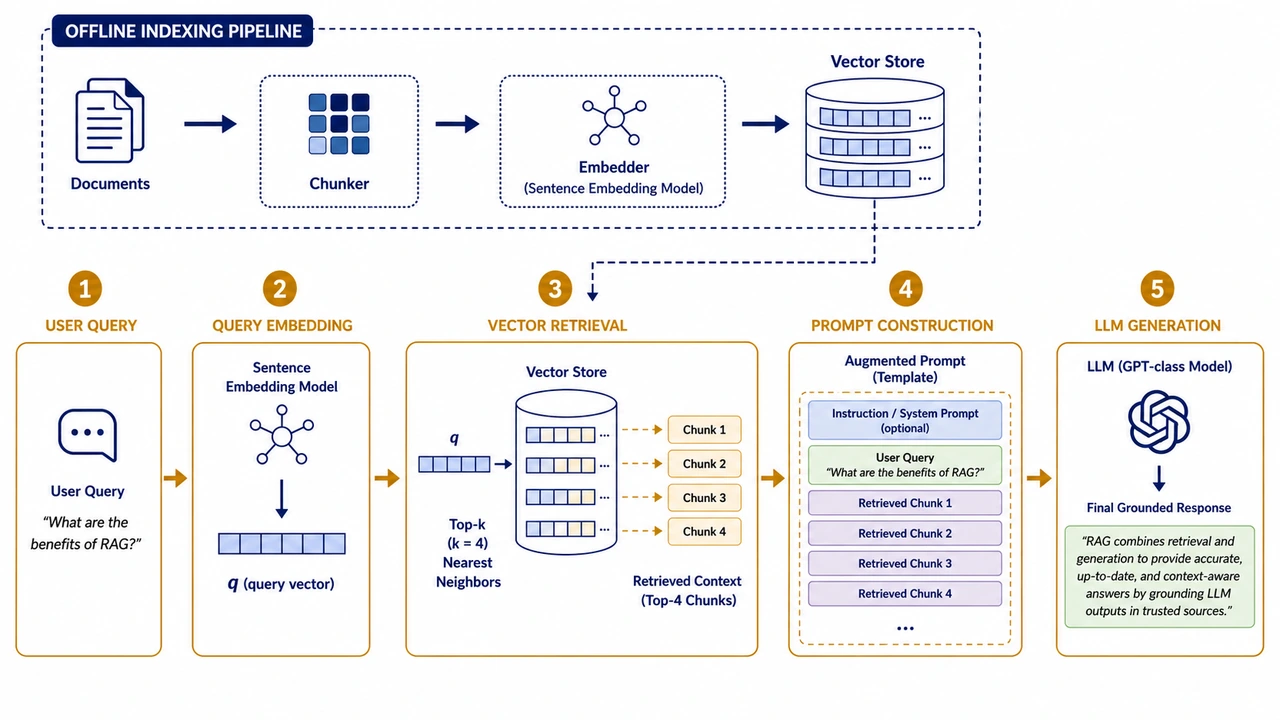
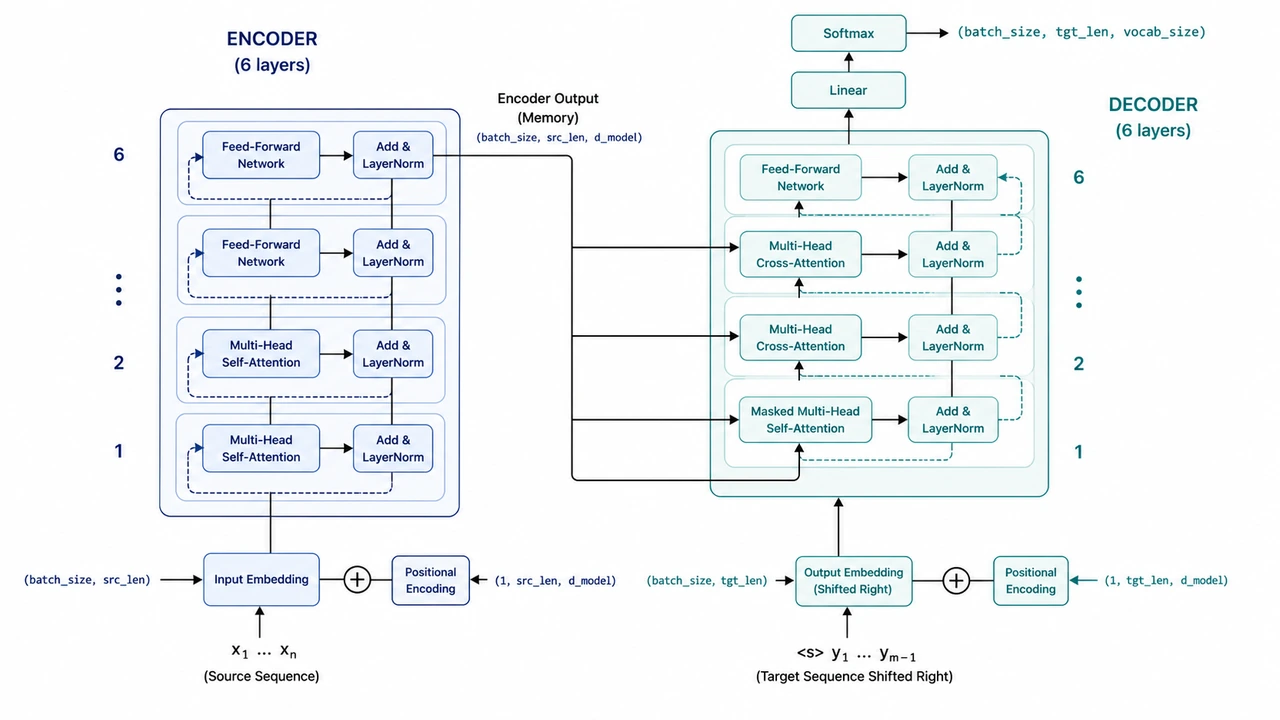
RAG, Transformer, 에이전트 워크플로, 학습 파이프라인, 포스터, 논문 그림 템플릿으로 시작해 원하는 학술 그림 형식에 더 가까운 결과를 만듭니다.

손그림 초안을 투고용 그림으로

손그림 초안을 투고용 그림으로

손으로 그린 초안, 스크린샷, 기존 다이어그램을 참고 이미지로 사용하세요. 레이블, 관계, 수식, 데이터 의미를 검토할 수 있는 깔끔한 논문용 그림으로 재구성합니다.

사용 방법

Paper Banana로 논문 그림 그리기

Paper Banana가 먼저 그림의 구조를 잡아 주면, 연구자는 과학적 내용과 레이블을 검토하고 필요한 파일 형식으로 내보내면 됩니다.

1

필요한 그림 설명하기

방법론 문단, 프롬프트, 스케치, 참고 이미지로 시작하세요. 그림에 필요한 모듈, 레이블, 관계를 함께 적으면 됩니다.

2

구조화된 초안 생성하기

스타일과 파일 형식을 고르면 Paper Banana가 먼저 검토할 수 있는 깔끔한 학술 그림 초안을 생성합니다.

3

검토 후 내보내기

과학적 내용을 확인하고, 복잡한 레이블과 화살표를 다듬은 뒤 논문, 포스터, 연구계획서, 발표, 교육용으로 PNG, draw.io, PPT 파일을 내보냅니다.

요금

Paper Banana AI 요금

표준 논문 그림은 5 크레딧부터 시작합니다. 한 번의 논문 작업에는 크레딧 패키지를, 연구실에서 꾸준히 사용한다면 구독 요금제를 선택하세요.

전체 요금제 보기
50% OFF

Basic

$12.49/월
$299.88$149.9/년50% 절약

표준 논문 그림 1장당 약 $0.1–$0.17

논문, 포스터, 연구실 발표 하나를 완성하기에 적합

안전한 결제 · 언제든지 해지 가능


  • 월 600 크레딧(연 7,200 크레딧)
  • 연 900–1,440장 생성 가능
  • 모든 AI 이미지 모델: GPT Image 2, Nano Banana 2 / Pro
  • 논문 내용이나 학술 템플릿으로 연구 그림 생성
  • 참고 그림을 업로드해 일관된 시각 스타일 유지
  • 워터마크 없는 HD PNG, 편집 가능한 PPT / draw.io 내보내기
  • 개인 및 상업 프로젝트에 사용 가능

    크레딧 유효 기간: 연간 구독 기간

    50% OFF

    Enterprise

    $49.95/월
    $1,198.8$599.4/년50% 절약

    표준 논문 그림 1장당 약 $0.07–$0.11

    연구실, 연구팀, 여러 프로젝트를 동시에 진행하는 경우에 적합

    안전한 결제 · 언제든지 해지 가능


    • 월 3,600 크레딧(연 43,200 크레딧)
    • 연 5,400–8,640장 생성 가능
    • 모든 AI 이미지 모델: GPT Image 2, Nano Banana 2 / Pro
    • 논문, 연구계획서, 발표, 교육용 그림을 고빈도로 생성
    • 논문 내용과 참고 그림을 활용한 지속적인 초안 개선
    • 워터마크 없는 HD PNG, 편집 가능한 PPT / draw.io 내보내기
    • 개인 및 상업 프로젝트에 사용 가능

      크레딧 유효 기간: 연간 구독 기간

      일회성 구매구독 전에 크레딧으로 시작하세요
      $6.99
      100 크레딧 · 일회성 구매 · 구독 없음

      더 많은 그림을 만든 후 구독을 결정하세요. 계정당 1회 구매할 수 있습니다.

      Stripe로 안전하게 결제
      지원하는 결제 수단

      Paper Banana AI 자주 묻는 질문

      Paper Banana는 누구에게 적합한가요?+

      방법 구조도, 모델 아키텍처, 학습 파이프라인, 포스터, 연구계획서, 발표 자료가 필요한 AI/ML, 컴퓨터공학, 공학 분야 연구자와 연구팀에게 적합합니다.

      Paper Banana AI는 무엇을 하나요?+

      논문의 방법론, 모델 설명, 프롬프트 템플릿, 스케치, 참고 이미지를 검토하고 수정할 수 있는 학술 일러스트로 바꿔 줍니다.

      생성한 그림을 논문에 바로 사용해도 되나요?+

      AI가 생성한 학술 그림은 반드시 검토하세요. 투고 전에 레이블, 화살표, 수식, 구성 요소 이름, 데이터 의미, 학술지 규정을 확인하고 필요한 수정을 마치는 것이 좋습니다.

      일반 AI 이미지 생성기와 어떻게 다른가요?+

      일반 이미지 도구가 시각적 인상에 초점을 맞춘다면, Paper Banana는 방법론 구조, 모델 블록, 파이프라인 화살표, 짧은 레이블, 편집 가능한 내보내기 등 논문 그림 작업에 초점을 맞춥니다.

      한 번 생성하는 데 크레딧이 얼마나 필요한가요?+

      1K 이미지는 보통 5–8 크레딧, 2K는 8–18 크레딧, 4K는 16–40 크레딧을 사용합니다. 편집 가능한 PPT와 draw.io 내보내기는 각각 8 크레딧이 추가됩니다.

      생성에 실패하면 어떻게 되나요?+

      서비스 제공사 측에서 실패하면 가능한 범위에서 실패 상태를 표시합니다. 결제, 중복 차감, 기술적 오류는 계정 이메일과 주문 정보를 함께 지원팀에 보내 확인할 수 있습니다.

      프롬프트와 논문 내용, 참고 이미지는 안전한가요?+

      현재 개인정보 처리방침에 따라 사용하고, 서비스에 공유할 수 없는 민감한 자료는 업로드하지 마세요. 팀 단위 보안, 세금계산서, 특정 데이터 처리 조건이 필요하면 구매 전에 지원팀에 문의하세요.

      크레딧 패키지와 월 구독 중 무엇을 골라야 하나요?+

      한 편의 논문, 학회 포스터, 연구계획서, 발표 자료를 집중적으로 준비한다면 일회성 크레딧 패키지가 유연합니다. 매주 반복적으로 그림을 만들거나 연구실 워크플로에 사용한다면 월 구독이 더 적합합니다.

      Paper Banana로 첫 번째 논문 그림을 만들어 보세요

      프롬프트를 고르거나 설명할 방법론을 입력하세요. 먼저 검토 가능한 초안을 만든 뒤 PNG, draw.io, 편집 가능한 PPT로 내보낼 수 있습니다.

      Paper Banana로 생성하기